WP Server Monitor Dashboard
A lightweight WordPress plugin that provides a real‑time system monitoring dashboard. Built with PHP, PowerShell automation, and WinUI 3 prototypes, it helps developers and sysadmins visualize CPU, RAM, and disk usage directly inside WordPress with modular, extensible design.
by Zahid Hasan · github.com/zahidhasan/wp-server-monitor-dashboard
Install
No release zip yet. The repository archive installs, but the folder name will carry the branch suffix and updates will not flow:
wp plugin install https://github.com/zahidhasan/wp-server-monitor-dashboard/archive/refs/heads/main.zip
WP Server Monitor Dashboard
📊 Real‑time server health, alerts, and live metrics — right inside WordPress.
WP Server Monitor Dashboard helps you track server performance with live charts, custom alerts, and fast startup. Stay on top of uptime and resource usage directly from your WordPress dashboard, with a clean interface designed for both developers and site owners.
🖥️ Overview
Version: 2.0
Author: Zahid Hasan
A lightweight WordPress plugin that provides a real‑time system monitoring dashboard.
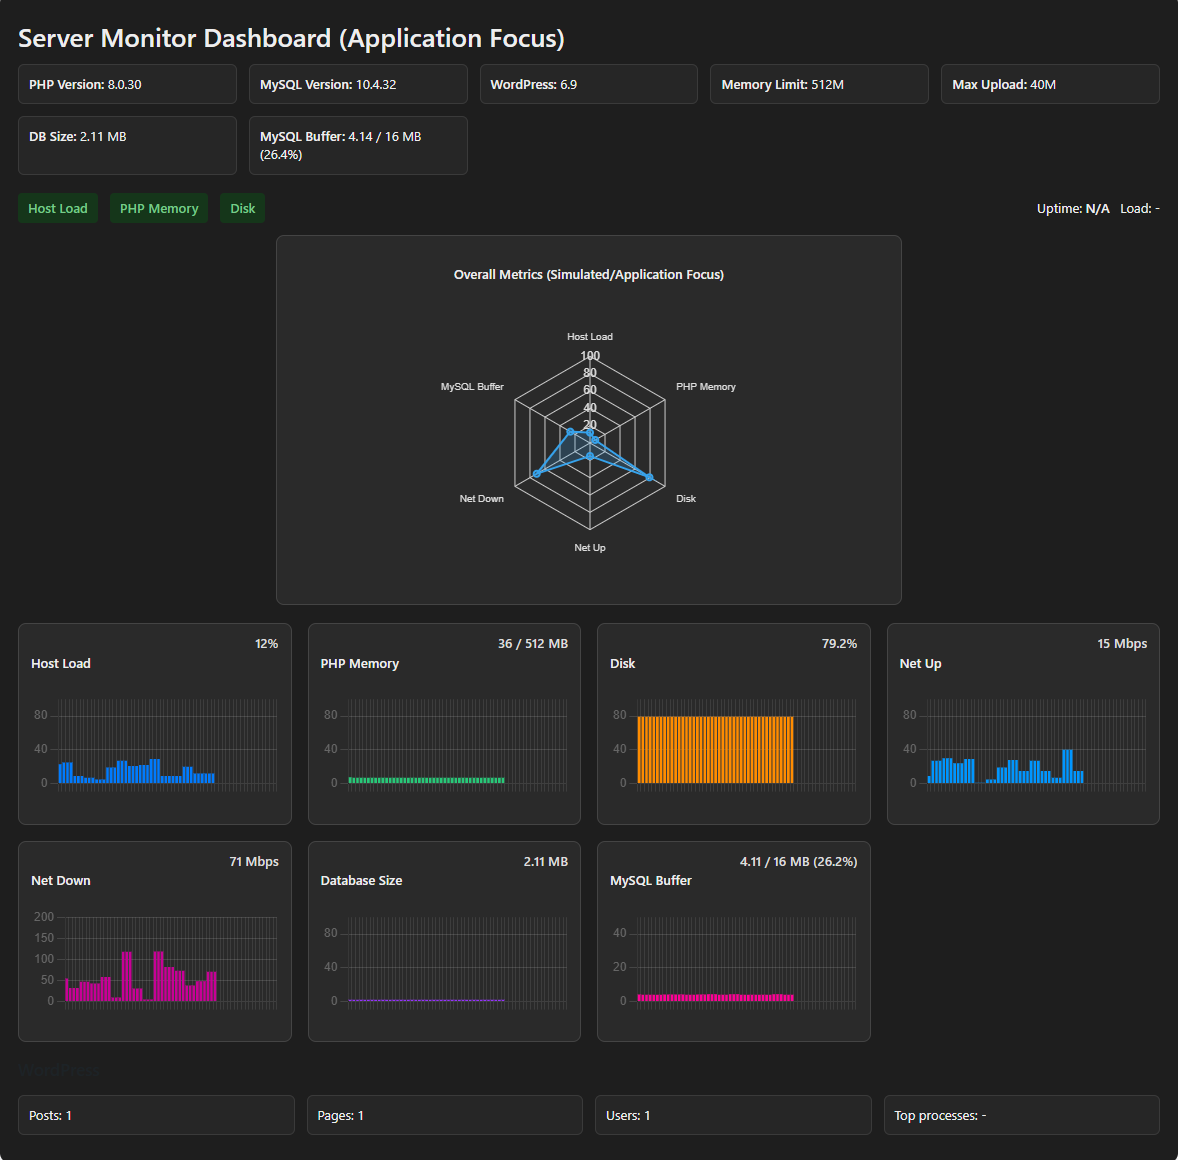
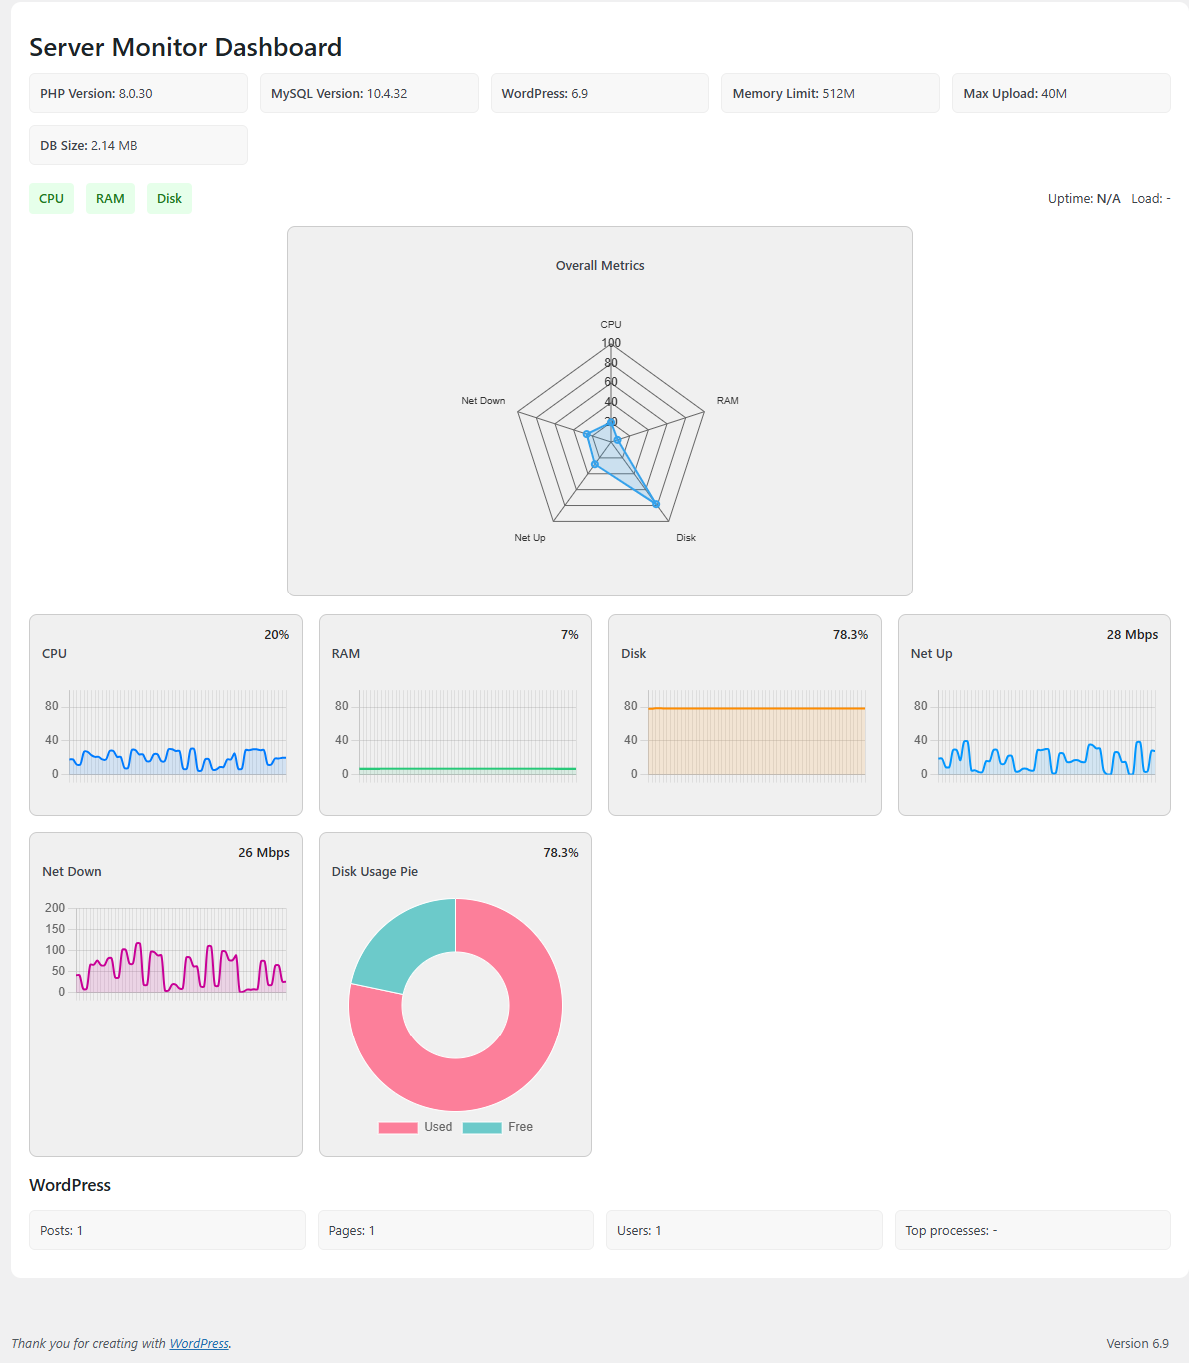
Live CPU, RAM, Disk, Network, Process, and MySQL Buffer charts appear in a top-level WordPress menu.
Built with PHP and PowerShell automation, this plugin helps developers and sysadmins visualize server health directly inside WordPress.
📸 Screenshots
Dark Theme
Light Theme
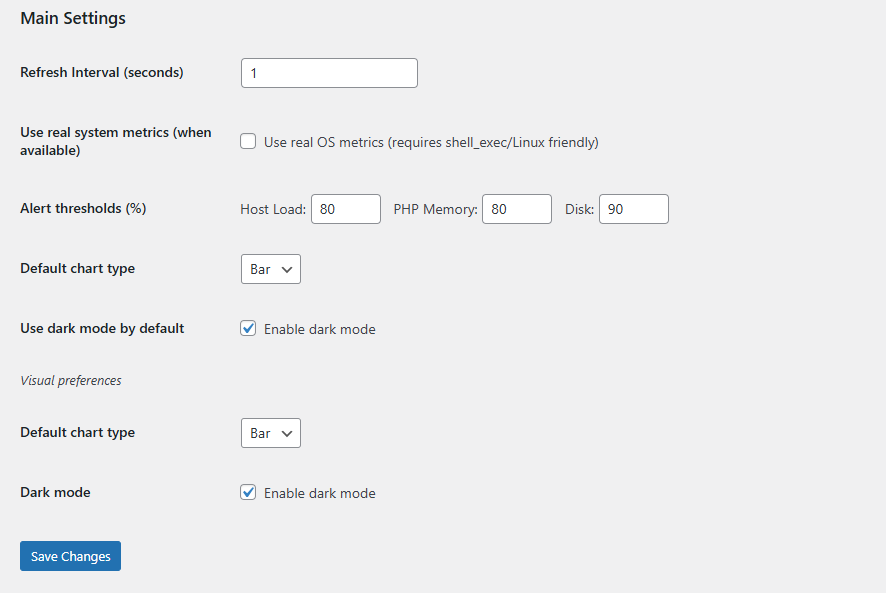
Settings
🚀 Features
- 📊 Real-time charts: CPU, RAM, Disk, Network I/O
- 🧠 Info panels: PHP, MySQL, WordPress version, memory limits, DB size
- 📚 WordPress content stats: posts, pages, users
- ⚡ AJAX + REST-powered updates every 2 seconds
- 🎨 Clean, responsive layout with Chart.js
- 🛡️ Alert thresholds for CPU, RAM, and Disk usage
- 🔍 Top processes view
Why Server Monitor Dashboard is Different
Most WordPress monitoring plugins focus only on uptime or basic performance checks. Server Monitor Dashboard goes further by giving you a complete, real‑time view of your server’s health directly inside WordPress.
- 🔍 Deeper Insights — Track CPU, RAM, Disk, and Network usage with intuitive charts and gauges.
- ⚡ Lightweight & Fast — Built to run smoothly without bloating your WordPress installation.
- 🎯 Application‑Focused Metrics — See PHP, MySQL, and WordPress resource usage alongside server stats.
- 🖥️ Visual Dashboard — Radar charts, line graphs, and pie charts make complex data easy to understand.
- 🔔 Custom Alerts — Get notified when thresholds are crossed, so you can act before issues escalate.
-
🌐 Self‑Contained — No external services or subscriptions required — your data stays in your WordPress site. This combination of real‑time server metrics + WordPress integration makes Server Monitor Dashboard unique compared to plugins that only check uptime or rely on third‑party services.
📊 Chart Guide
- CPU Usage → Detect spikes and bottlenecks
- RAM Usage → Spot leaks or heavy processes
- Disk Usage → Monitor capacity and I/O activity
- Network Throughput → Identify unusual traffic or saturation
- Process Count → Detect runaway tasks
- MySQL Buffer Pool → Optimize caching and DB performance
- Spider Chart → Holistic system overview
🛠 Troubleshooting
- CPU > 90% → Check processes, optimize tasks, consider scaling
- RAM > 85% → Identify leaks, restart services, increase limits
- Disk > 90% → Clear logs/temp files, expand capacity
- High Network I/O → Inspect connections, apply firewall rules
- Process spikes → Audit cron jobs/services
- MySQL Buffer > 80% → Tune buffer size, optimize queries
🛣 Roadmap
v2.1 → Uptime tracking, thread/process details, custom alerts
v2.2 → Log viewer, service monitoring, historical trends
v3.0 → Multi-server metrics, security insights, predictive capacity planning
⚡ Quick Setup
- Upload plugin via WordPress Admin → Plugins → Add New → Upload
- Activate the plugin
- Access Dashboard → Server Monitor
🛠 Installation
- Download latest release (Gumroad/CodeCanyon or repo)
- Upload via WordPress Admin → Plugins → Add New → Upload Plugin
- Activate plugin
- Verify charts load correctly
- Troubleshoot: check PHP version, remove BOM/whitespace, adjust polling interval
⚙️ Usage
- Navigate to Dashboard → Server Monitor
- View live stats (CPU, RAM, Disk, Network, MySQL Buffer)
- Configure settings via plugin options
🛠 Requirements
- WordPress 5.0+
- PHP 7.4+
- Chart.js (auto-loaded via CDN)
❓ FAQ
- CPU load vs Task Manager? → Plugin shows averaged usage, Task Manager shows per-core peaks.
- RAM mismatch? → Task Manager includes cached/reserved memory; plugin shows active allocation.
- MySQL Buffer Pool? → Displays InnoDB buffer usage vs allocation.
- Unexpected output during activation? → Remove stray spaces/BOM characters.
- Multi-server monitoring? → Planned for v3.0.
- Chart refresh rate? → Default: every 2 seconds.
- Performance impact? → Minimal; adjust polling interval for high-traffic sites.
- Network chart shows traffic with Wi-Fi off? → Reads all interfaces (Ethernet, VPN, Docker, etc.), not just Wi-Fi.
📖 Manual
🤝 Contributing
- Report bugs → GitHub Issues
- Request features → GitHub Issues
- Fork → Branch → Commit → Pull Request
Community Guidelines:
- Be respectful and constructive
- Keep discussions technical
- Contributions reviewed before merging
💖 Support the Project
If this plugin makes your server life easier, you can fuel my coding sessions with a coffee ☕:
- Buy Me a Coffee
- Ko‑fi
- Patreon
Every cup helps me keep building new features, polishing docs, and pushing updates. Thanks for supporting independent development!
📚 Glossary
- CPU → Processor utilization
- RAM → Active memory usage
- Disk Usage → Storage capacity + I/O activity
- Network Throughput → Upload/download bandwidth across interfaces
- Processes → Active tasks/programs
- MySQL Buffer Pool → InnoDB cache utilization
- Spider Chart → Multi-axis overview of system health
- Polling Interval → Frequency of metric updates
📜 License
MIT License — see LICENSE
🙌 Credits
- Chart.js for charts
- WordPress Plugin API for admin integration