Install
This is the repository archive. It installs, but the folder name will carry the branch suffix and updates will not flow.
Install straight from GitHub with WP-CLI:
wp plugin install https://github.com/westcoastdigital/gf-views-analytics/archive/refs/heads/main.zipA WordPress plugin that provides an analytics dashboard for Gravity Forms views and entries.
Description
GF Views Analytics adds a reporting page under Tools > Views Analytics that lets you visualise and analyse Gravity Forms view and entry data over time. Filter by form and date range, compare periods side by side, overlay entries against views, and export reports as PDF or CSV. The dashboard is also accessible via Forms > Views Analytics in the Gravity Forms admin menu and via the admin bar.
Requirements
- WordPress 5.8+
- PHP 8.0+
- Gravity Forms (any current version)
Installation
- Upload the
gf-views-analyticsfolder to/wp-content/plugins/ - Activate the plugin through Plugins > Installed Plugins
- Navigate to Tools > Views Analytics, Forms > Views Analytics, or use the admin bar shortcut
Filters
- Forms — multi-select dropdown with search; choose one, many, or all forms
- Date range — primary date range with a date picker
- Quick presets — Last 7 days, Last 30 days, Last 90 days, Month to date, Year to date
- Granularity — group data by Day, Week, or Month; automatically switches to hourly when a single day is selected
- Entries overlay — toggle entries data on or off
- Compare range — enable a second date range to compare periods side by side
- Chart view — control how the main chart area is displayed (see below)
Dashboard
- Stat cards — Total Views, Total Entries, Conversion Rate; each card shows a delta badge when a comparison period is active
- Comparison breakdown cards — when a compare range is active, a row of cards appears above the main chart showing Total Views and Total Entries for each date range individually, colour-coded to match the chart series (purple/red for views, teal/amber for entries)
- Line charts — views and entries over time; display is controlled by the Chart view toggle
- Views by form bar chart — total views broken down per form (shown when multiple forms are in the result set); switches to a grouped bar chart when a compare range is active, with primary and compare bars side by side
- Entries by form bar chart — total entries broken down per form (shown when multiple forms are in the result set and entries overlay is on); also grouped when a compare range is active
- Data table — full period-by-period breakdown including deltas and conversion rate
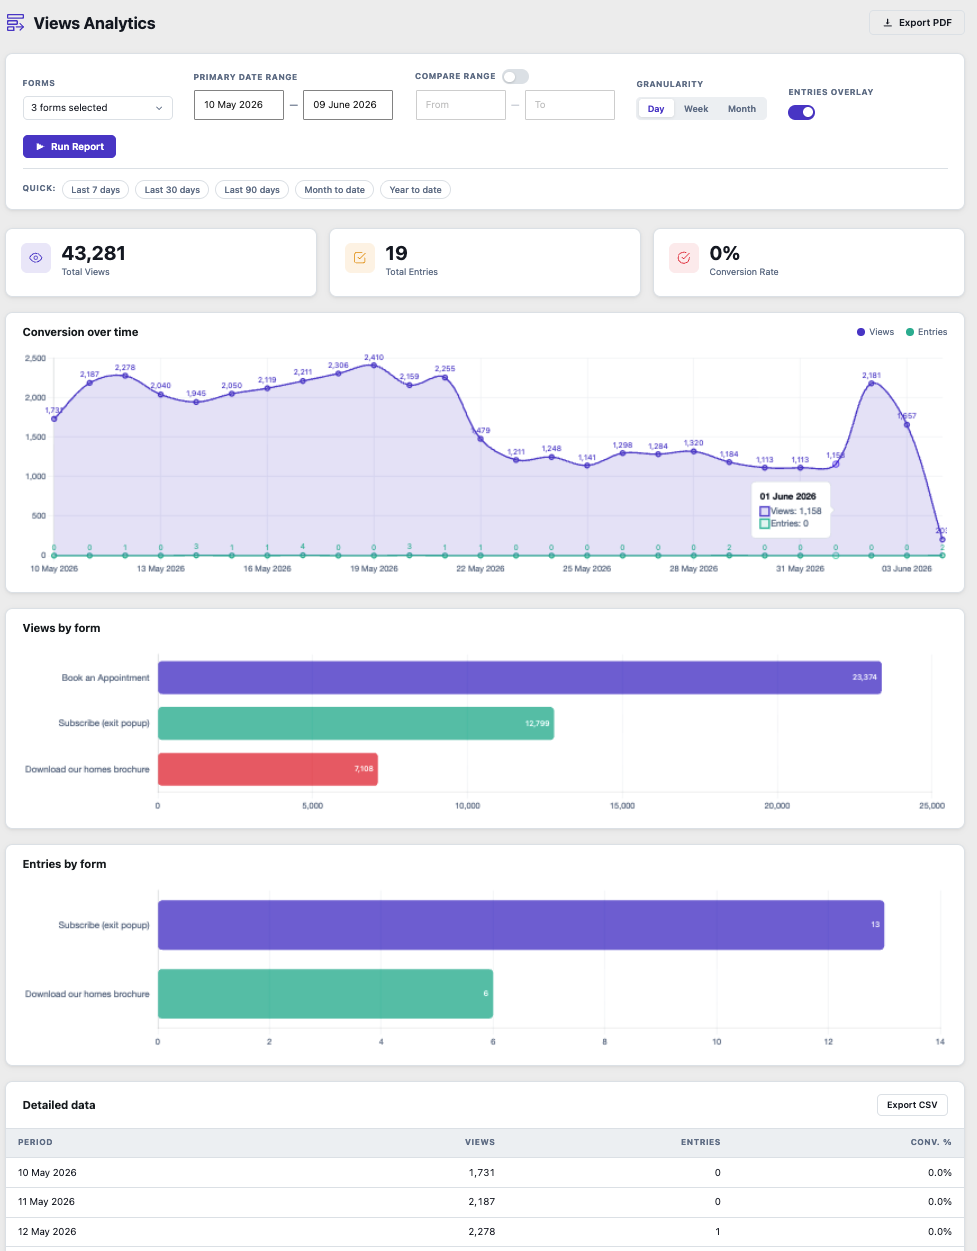
Chart View
The Chart view segmented control in the filters row changes how the line chart area is rendered without re-running the report:
- All — three charts stacked: Views only, Entries only, and Combined (views and entries together)
- Combined — views and entries on a single chart (the classic default)
- Views — views line only; useful when entry counts are so much smaller they become unreadable alongside views
- Entries — entries line only
The selected chart view is saved to the URL so bookmarked or shared reports restore the same layout.
Exports
- PDF — opens the browser print dialog with a print stylesheet optimised for A4 portrait; includes a report header with period, forms, and generated timestamp
- CSV — downloads directly in the browser with all visible columns including deltas
URL State
All filters — including form selection, date ranges, granularity, compare range, entries overlay, and chart view — are written to the URL when you run a report. Switching the chart view also updates the URL immediately without re-running. Reports can be bookmarked, shared, or refreshed and will restore exactly.
Date Format
The date format used throughout the dashboard and exports can be set per user via Screen Options (top right of the page). Available options are:
- DD/MM/YYYY
- MM/DD/YYYY
- YYYY-MM-DD
- DD Mon YYYY
- DD Month YYYY
- WordPress default (inherits the format set under Settings > General)
Each user's preference is saved independently so it does not affect other users.
PDF White Label
The PDF report header can be customised per user via Screen Options. Options include:
- Report title — replaces the default "GF Views Analytics Report" heading
- Logo — replaces the plugin icon and page heading; accepts a URL or choose from the media library. Recommended height: 40px.
White label settings are saved per user and take effect immediately when running a new report.
Changelog
1.1.6
- Fixed legend colour swatches missing in PDF/print — the line chart legends (Conversion/Views/Entries over time) are custom HTML dots coloured via
background, which browsers omit by default when printing; addedprint-color-adjust: exactto.gfva-wrapin the print stylesheet so colours are forced to render (applied to both print blocks)
1.1.5
- Fixed detailed data table headers overlapping in PDF/print — header cells now wrap onto multiple lines instead of colliding (the base no-wrap rule is overridden inside the print stylesheet, and applied to both print blocks)
1.1.4
- Fixed comparison alignment — when a compare range is active, the data table, line charts, and CSV export now align the two periods positionally (primary day 1 against compare day 1, day 2 against day 2, and so on) instead of by absolute calendar date. Previously, comparing two non-overlapping ranges (e.g. 1–7 June vs 8–14 June) placed each period on its own rows with meaningless deltas and blank conversion values; periods now line up so deltas and conversion read correctly
- Added a Period (compare) column to the table and a
Period_Comparecolumn to the CSV so the aligned compare date is visible on each row - Line chart tooltips now show the aligned compare date alongside the primary date
- Per-form breakdown charts now include forms that appear in either the primary or compare period (union), sorted by combined total
1.1.3
- Fix Merge conflict There were merge conflicts in the JS file causing it to break
1.1.2
- Added Chart view toggle (All / Combined / Views / Entries) — switch between chart layouts instantly without re-running the report; selection is persisted to the URL
- All mode stacks three charts: Views only, Entries only, and Combined
- Updated Views by form and Entries by form bar charts to show grouped comparison bars when a compare range is active — primary and compare periods appear side by side per form, colour-coded to match the chart series (purple/red for views, teal/amber for entries); chart height scales automatically with the number of forms
- Added form selection to URL state so selected forms are preserved on page load and when switching chart view
- Fixed comparison breakdown cards being cut off in PDF/print — switched to a 2-column print grid with full date wrapping
- Fixed stat cards not filling page width in PDF/print — corrected print grid to 3 columns
1.1.1
-
Updated Views by form and Entries by form bar charts to show grouped comparison bars when a compare range is active — primary and compare periods appear side by side per form, colour-coded to match the main chart series (purple/red for views, teal/amber for entries); chart height scales automatically with the number of forms to prevent cramped bars
-
Fixed GitHub updater ignoring release tags with an uppercase
Vprefix -
1.1.0
-
Added comparison breakdown cards — when a compare range is active, a row of stat cards appears above the main chart showing Total Views and Total Entries for each date range individually, with the date range displayed on each card and colours matching the corresponding chart series
1.0.8
- Fixed Graph Values graph values dropped off
1.0.7
- Fixed Views over time graph colours match the legend and renamed to Conversion over time
1.0.6
- Added Views Analytics link to the Gravity Forms admin menu under Forms > Views Analytics
- Added Views Analytics shortcut to the WordPress admin bar under the Gravity Forms node
- Fixed PDF export charts being cut off — charts now resize to fit the full A4 page width before the print dialog opens, and all chart canvases are constrained within their containers in the print stylesheet
- Added data labels to all charts: values appear above each point on the line chart (suppressed when the dataset has more than 60 points to avoid crowding) and right-aligned inside each bar on the Views by form and Entries by form bar charts
1.0.5
- Fix Bug Fix Minor bug fixes and readme updates
1.0.4
- Added Entries by form bar chart alongside the existing Views by form chart
- Fixed missing
by_formdata assignment that prevented both breakdown charts from rendering
1.0.3
- Fixed date format display in chart and table — tokens now replaced in a single pass to prevent partial replacements corrupting month names
- Added date format preference via Screen Options, saved per user via AJAX
- Date pickers now reflect the chosen display format via Flatpickr's alt input
- Dates in print header now use the chosen display format
1.0.2
- Removed unique visitors stat (always returned 1 due to aggregated view rows)
- Fixed table column alignment — period column left-aligned, all data columns right-aligned
- Added hourly granularity, triggered automatically when a single day is selected
- Added timezone offset via
CONVERT_TZso period grouping reflects site local time
1.0.1
- Fixed view counts — queries now use
SUM(count)instead ofCOUNT(*)to read the actual view totals stored inwp_gf_form_view - Fixed timezone handling — date range boundaries now convert from site local time to UTC before querying
1.0.0
- Initial release
Data Source
Views are read from the wp_gf_form_view table that Gravity Forms maintains natively, summing the count column for accurate view totals. Entries are read from wp_gf_entry where status = 'active'. All database queries are timezone-aware and offset against the site timezone configured under Settings > General, so date boundaries reflect local time rather than UTC.
Releases
8 releases.
These releases are tags only. The author does not attach a packaged zip, so there are no download counts to report.