Install
This is the repository archive. It installs, but the folder name will carry the branch suffix and updates will not flow.
Install straight from GitHub with WP-CLI:
wp plugin install https://github.com/wagle001/prodigitips-splunk-integration/archive/refs/heads/main.zipWordPress security telemetry, streamed to Splunk — a miniature SOC pipeline for a WordPress site: log shipping via HTTP Event Collector, scheduled detections, and dashboards.
WordPress (prodigitips.com)                    Splunk
┌─────────────────────────────┐   HTTPS    ┌──────────────────────────────┐
│  Collector hooks            │  HEC :8088 │  index=main                  │
│  login_failed · 404 ·       │───────────▶│  sourcetype=wordpress:       │
│  php_fatal · plugin/core    │  batches   │           prodigitips        │
│  changes · WooCommerce …    │  (cron)    │                              │
│         │                   │            │  3 scheduled alerts          │
│  DB queue (cap 500, retry)  │            │  4 dashboards               │
└─────────────────────────────┘            └──────────────────────────────┘
Why
WordPress sites get brute-forced, probed for vulnerable plugins, and broken by bad updates — and the site owner usually finds out from users. This plugin turns those signals into searchable, alertable events, using the same architecture a SOC uses: agent → queue → SIEM → detection → dashboard.
What it collects
Each group is toggleable on the settings page:
- Authentication — successful logins, failed logins, logouts, registrations, password resets
- Content — posts published/deleted
- System — plugin/theme activation and changes, core/plugin/theme upgrades
- Errors — 404 hits (URI + referer), fatal PHP errors
- WooCommerce — order status changes, refunds, abandoned carts (default off)
- REST API / AJAX — route, method, status per request (default off — high volume)
Every event is enriched with site URL, host, blog ID, user ID, client IP (Cloudflare/proxy aware), and user agent.
Delivery: queued by default — events buffer in the DB during the request (zero page latency) and flush to Splunk in batches via WP-Cron, with retry and a visible drop counter. Immediate per-request mode is available.
Detections (splunk-app/)
| Alert | Logic | Schedule | ATT&CK |
|---|---|---|---|
| Brute-force logins | >10 failed logins per IP per username | every 15 min | T1110 |
| 404 spike | hourly 404 count vs. baseline | hourly | T1595.002 |
| Fatal PHP errors | any php_fatal event |
every 15 min | — |
Four dashboards ship alongside: login activity, 404s & PHP errors, system changes, WooCommerce orders.
Quickstart (Docker: WordPress + MySQL + Splunk)
git clone https://github.com/wagle001/prodigitips-splunk-integration.git
cd prodigitips-splunk-integration/docker
cp .env.example .env
docker compose up -d- WordPress: http://localhost:8080/wp-admin (
admin/admin) - Splunk Web: http://localhost:8000 (admin /
$SPLUNK_PASSWORD) - Verify:
index=main sourcetype="wordpress:prodigitips" | stats count by type - Dashboards/alerts:
./install-splunk-app.sh→ Apps → ProDigitips WordPress
Requirements: Docker Desktop. On Apple Silicon, install Rosetta once (softwareupdate --install-rosetta --agree-to-license). Full details: docker/README.md. Production install: docs/production-install.md.
Example searches
index=main sourcetype="wordpress:prodigitips" type="login_failed" | stats count by ip | sort -count

index=main sourcetype="wordpress:prodigitips" type="404" uri="*/wp-*" | stats count by uri

index=main sourcetype="wordpress:prodigitips" type="cart_abandoned" | table _time, customer_id, items, total
Screenshots
From the Docker stack after simulating a brute-force attack (31 failed logins against one account — see the demo script):
| Login activity dashboard | Brute-force alert triggered |
|---|---|
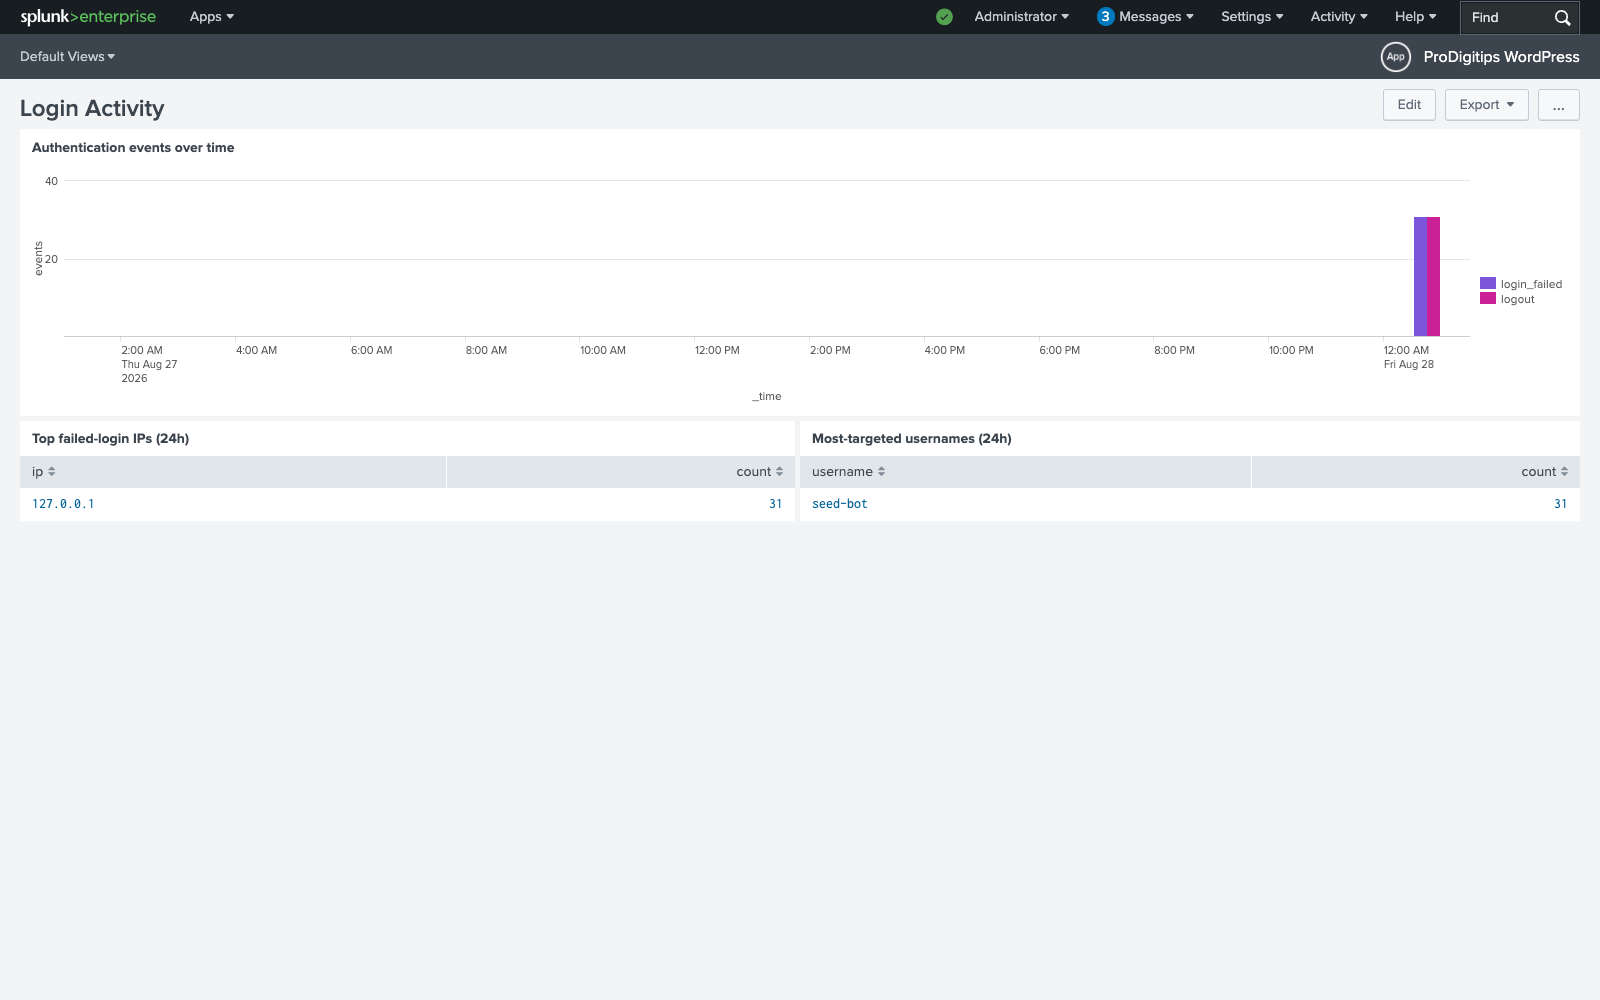 |
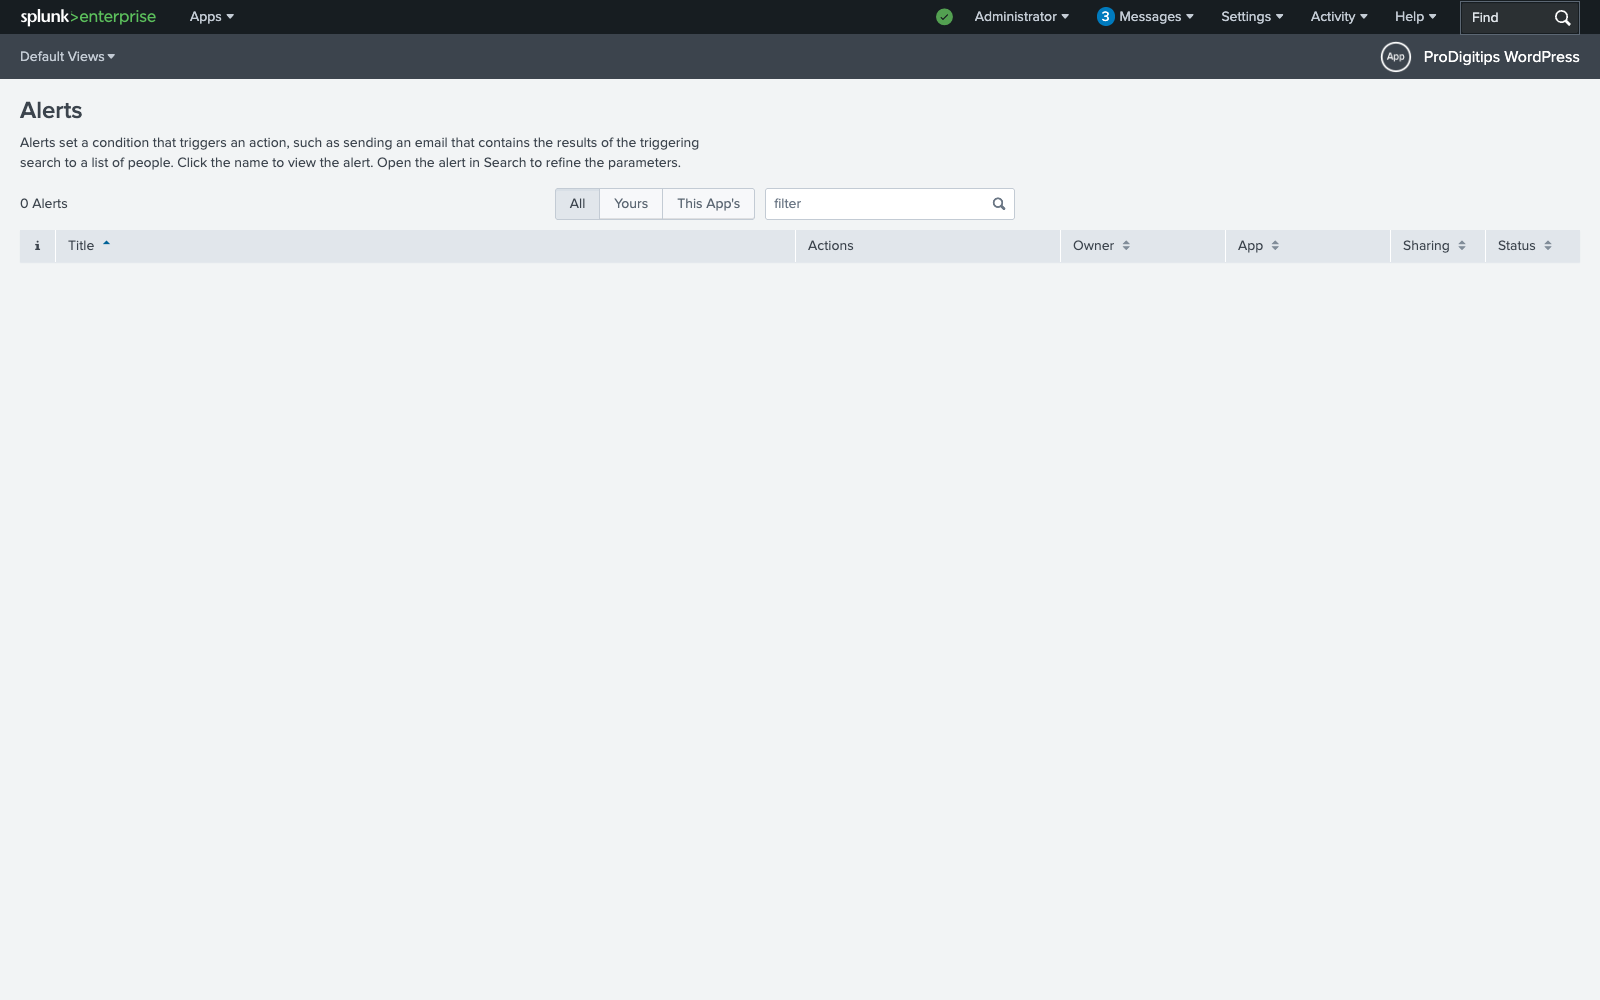 |
| 404s & PHP errors dashboard | Investigation search |
|---|---|
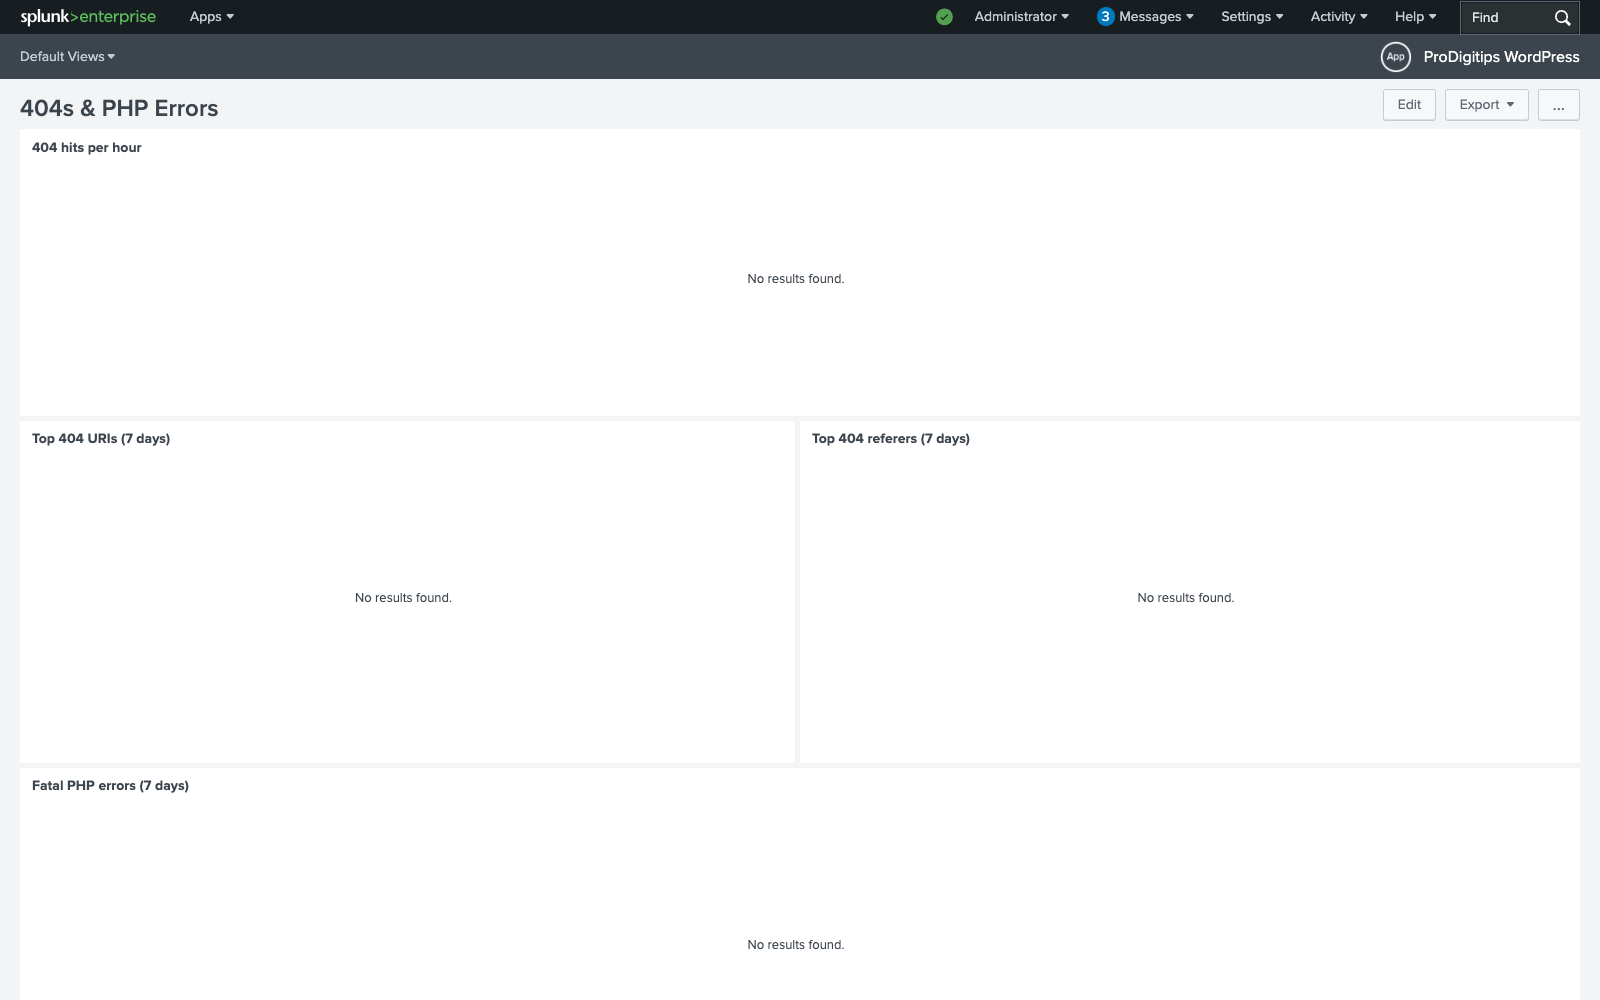 |
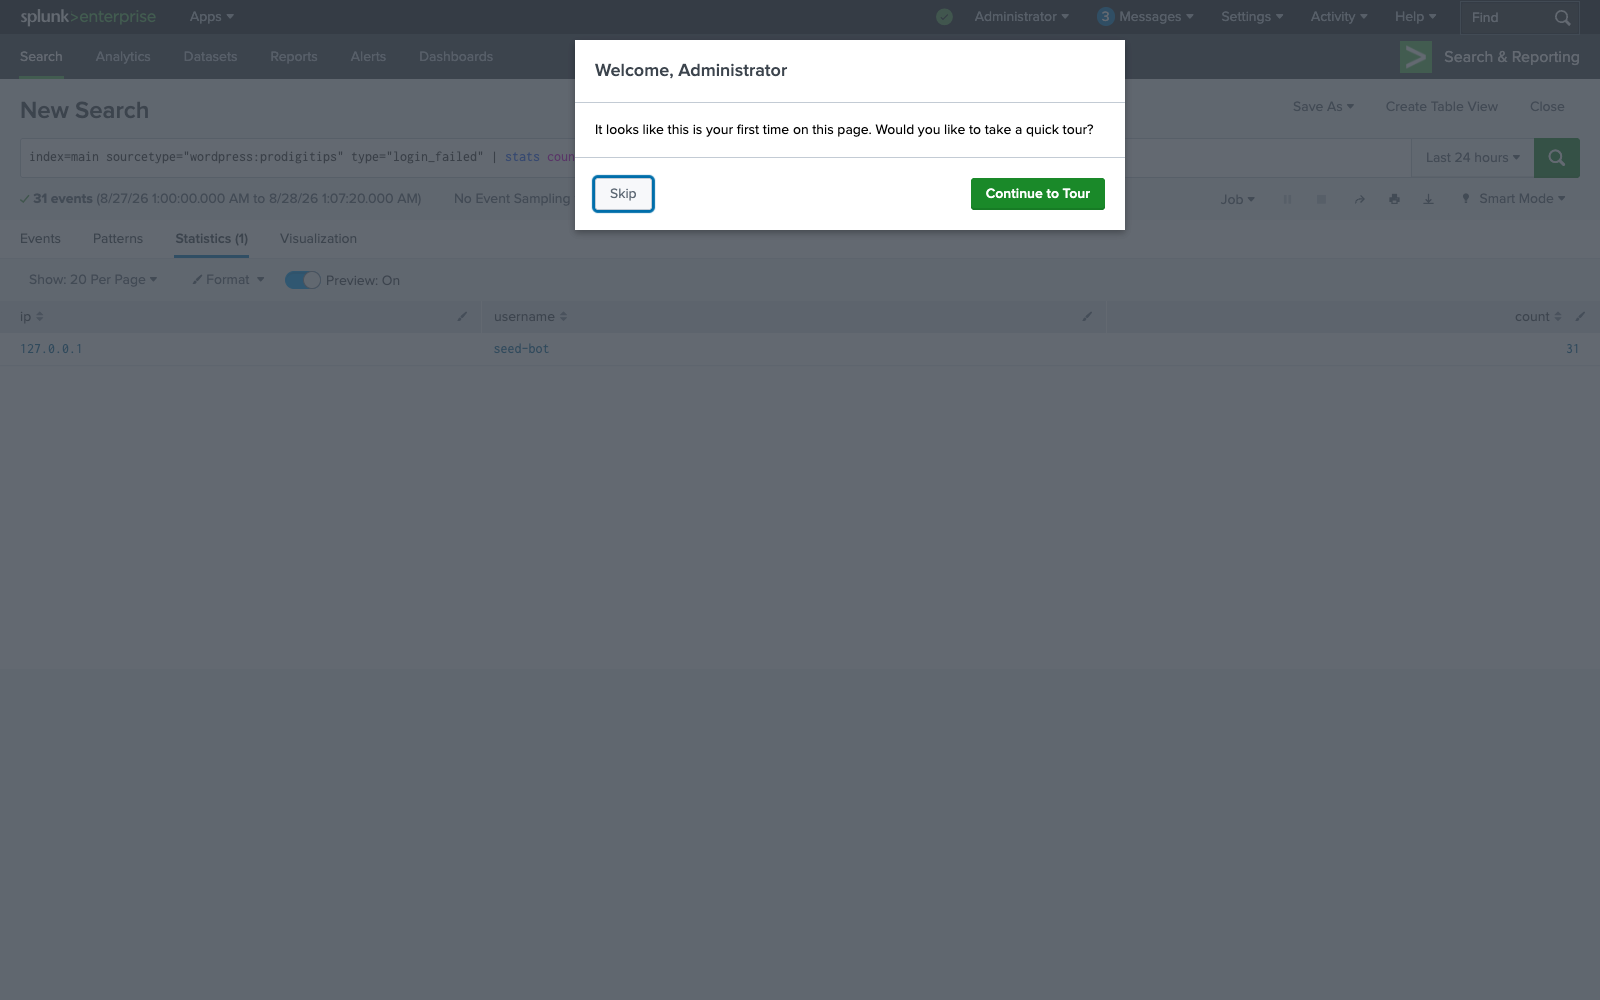 |
Requirements
WordPress 6.0+ · PHP 7.4+ · Splunk Cloud, Enterprise, or the provided Docker stack · GPL-2.0-or-later