REST API Tracer
See everything inside a WordPress REST request: hooks, SQL, outbound HTTP — timed, nested, and visualized as flame graphs and node maps.
Install
No release zip yet. The repository archive installs, but the folder name will carry the branch suffix and updates will not flow:
wp plugin install https://github.com/rafiahmedd/wp-rest-tracer/archive/refs/heads/master.zipREST API Tracer answers "what exactly happens inside this endpoint, and where does the time go?"
Pick the REST namespaces you care about — wc/v3, your plugin's routes, anything — and every matching request gets recorded end to end:
- every hook and filter callback that runs (via transparent callback wrapping),
- every SQL query, with its caller and per-query wall time,
- every outbound HTTP request (URL, method, status, duration),
- the REST handler bracket and permission check — resolved down to the real controller method, even behind framework-style delegating handlers like
Route::callback → CourseController::index.
Then explore the trace in wp-admin, your way: an interactive flame graph, a node-map view of the whole request lifecycle, a waterfall timeline, or an aggregated call tree for hotspots. New traces stream into the list live — no page reload.
Tracing is off by default: in header mode nothing is recorded unless a request carries your secret X-REST-Tracer token, so it's safe to keep installed on production.
Requirements
- WordPress 6.0+
- PHP 8.0+
Installation
- Download or clone this repository and place the
wp-rest-tracerfolder inwp-content/plugins/(or upload the ZIP via Plugins → Add New → Upload). - Activate REST API Tracer in the Plugins screen.
- Open Tools → REST Tracer.
Quick start
1. Tell it what to watch
Go to Tools → REST Tracer → Settings and enter one or more REST namespaces, comma-separated — for example wc/v3, myshop/v1. Not sure of the exact namespace? Use the Endpoints tab: type a namespace and it lists every route under it, exactly as the tracer would match it.
2. Capture a request
There are two trigger modes (Settings):
| Mode | What gets traced |
|---|---|
| Header (default, production-safe) | Only requests carrying X-REST-Tracer: <your token> |
| Always | Every request to a watched namespace (the plugin's own admin API is never self-traced) |
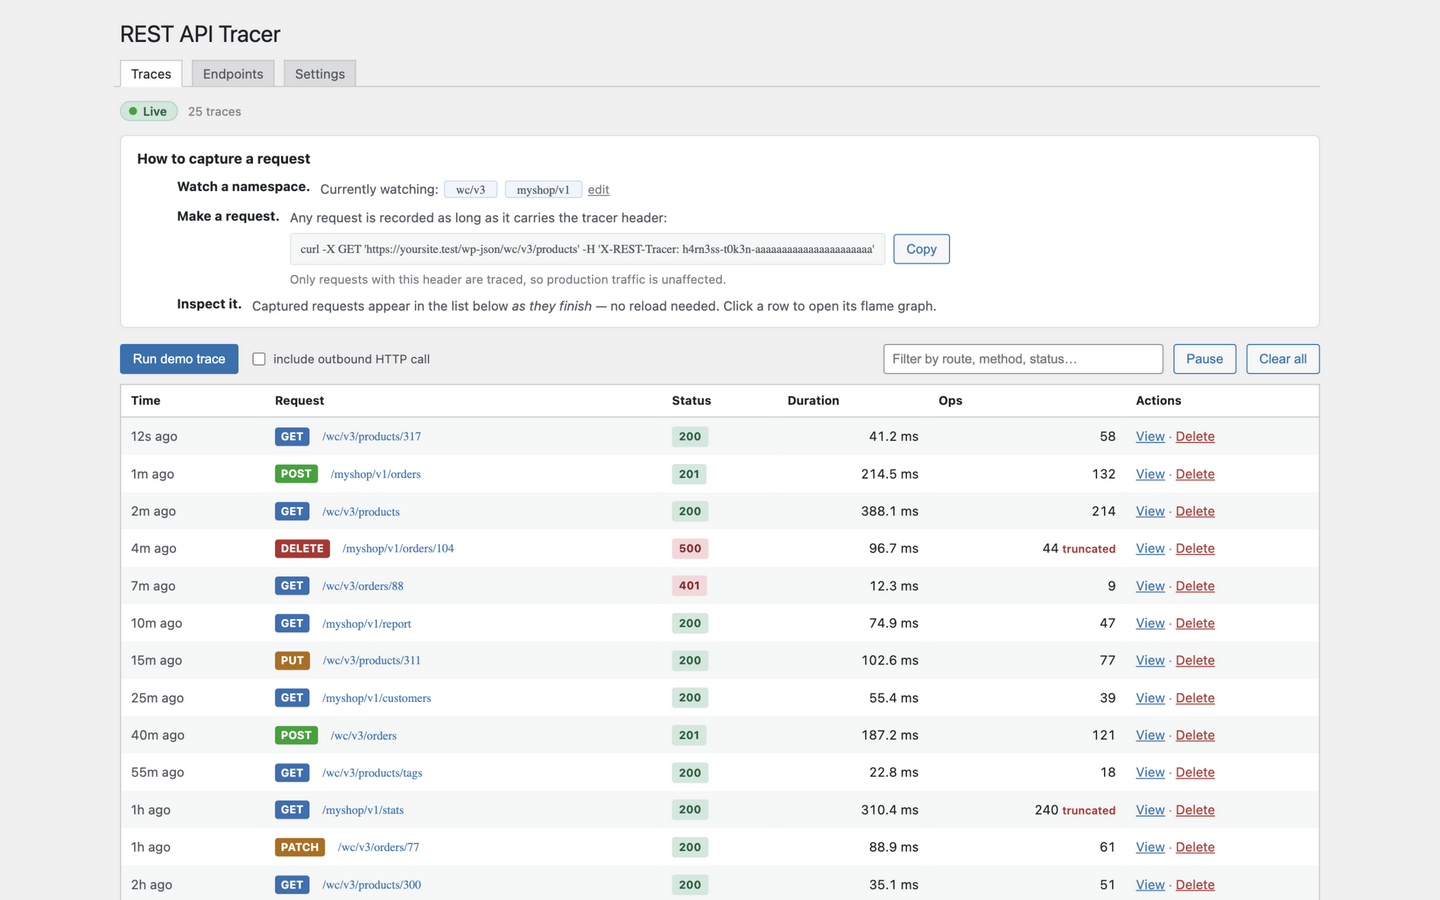
In Header mode, copy the ready-made curl command from the "How to capture a request" card on the Traces tab — it already contains your token:
curl -X GET 'https://yoursite.test/wp-json/wc/v3/products' \
  -H 'X-REST-Tracer: YOUR_TOKEN'
Any client works (Postman, fetch, your app's HTTP calls) — the header is the only requirement. You can also hit Run demo trace to capture a sample request without leaving wp-admin.
3. Watch it appear — live
Captured requests appear in the Traces table as they finish — no reload. The list shows relative times, method, route, status, duration, and operation count, with a text filter, pause/resume for live updates, and delete/clear actions that don't navigate away.
4. Open a trace
Click any row to open the viewer.
The viewer
Stat strip
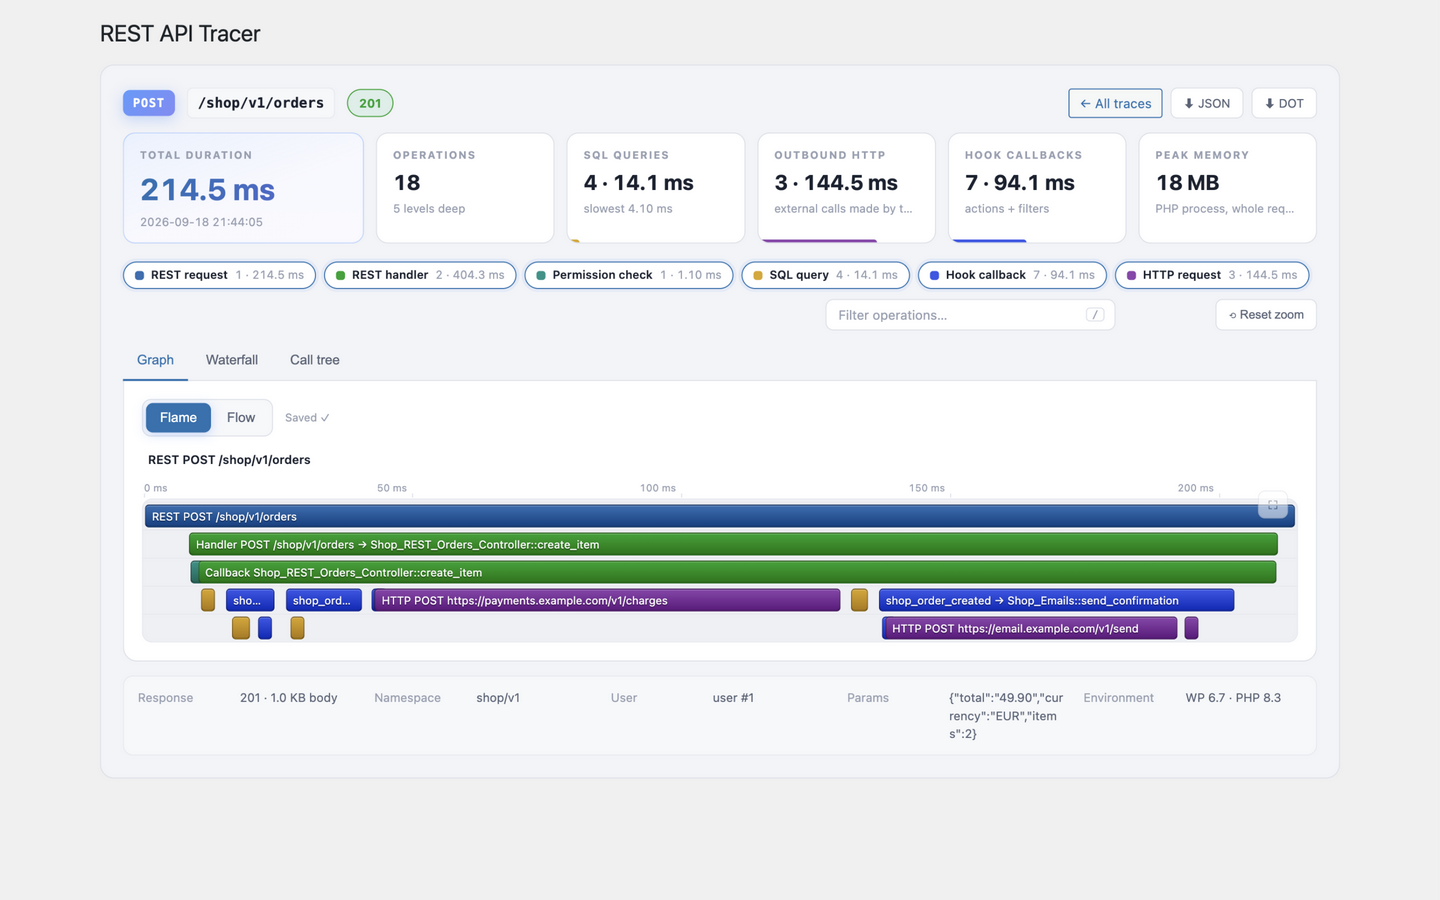
Before you touch anything, the strip answers "where did the time go": total duration, operation count and depth, SQL / outbound HTTP / hook totals with each category's share of the request, and peak memory.
Graph — two styles
Switchable with the Flame / Flow control (your choice is remembered per user, stored in the database):
- Flame — the classic profiler view: the request at the bottom, frames stacked upward, width proportional to duration. A millisecond ruler sits above the graph. Click any frame to zoom into it; the breadcrumb trail navigates back out. Dense stretches of micro-operations automatically collapse into aggregate frames ("N operations · X ms") that re-split as you zoom.
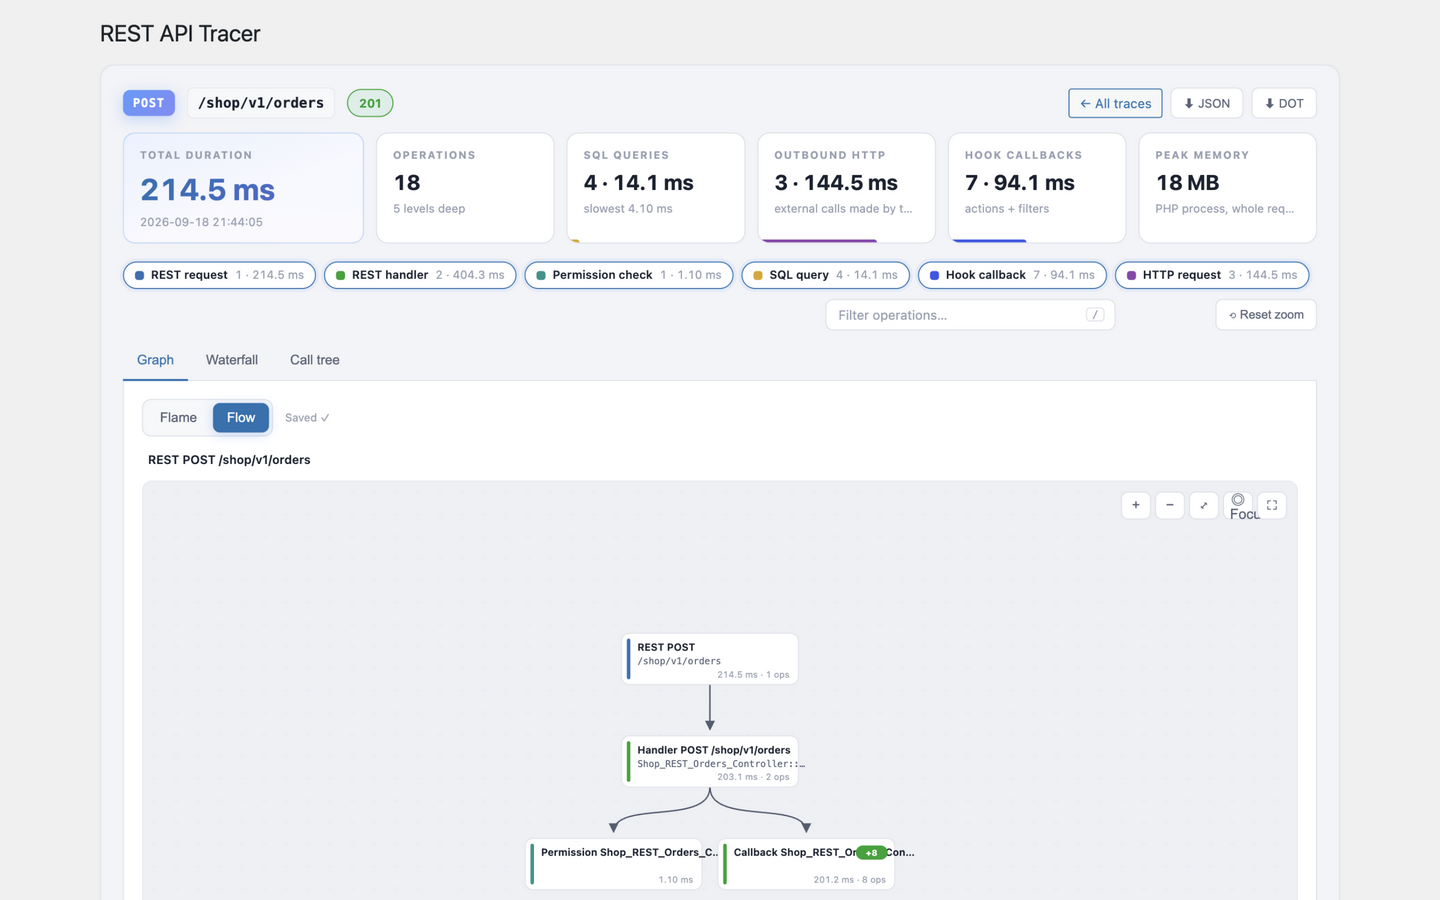
- Flow — the whole request lifecycle as an interactive node map: cards and arrows from the request down through handlers, hooks, queries, and outbound calls. Drag to pan, scroll to zoom, click a node to collapse or expand its branch. It opens focused on the initial request so you can navigate step by step, and the ◎ Focus button returns there any time.
Every canvas has a ⛶ button that expands just that graph fullscreen.
Waterfall
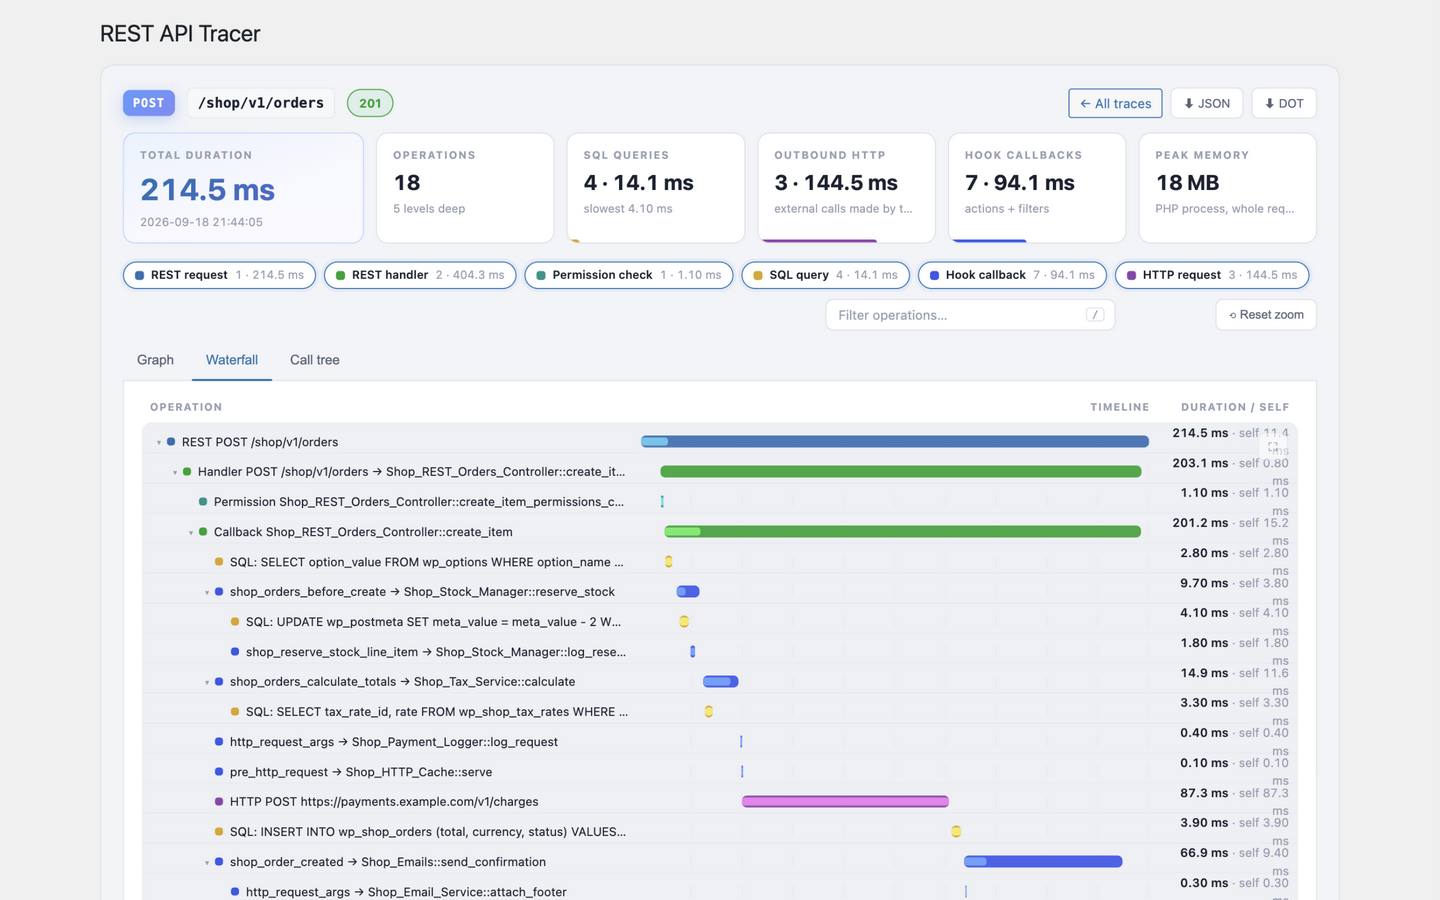
Chronological rows with gridlines, colored bars, and self-time rendered inside each bar — the view for "what ran when". Rows collapse with the caret.
Call tree
All operations aggregated by name, sorted by total time, with share-of-request bars — the fastest way to find hotspots.
Everywhere
- Type chips are a live legend and filter (SQL / HTTP / hooks / handlers / permission).
- Search (
/to focus,Escto reset zoom) highlights matches across the current view. - Tooltips show duration, self time, percentage of request/parent, SQL text, URLs, statuses, and callers.
- Export: download any trace as JSON or GraphViz
.dot(render withdot -Tsvg trace.dot -o trace.svg).
Settings reference
| Setting | Meaning |
|---|---|
| Namespaces | Comma-separated REST namespaces to watch |
| Trigger mode | Header (token-gated, default) or Always |
| Trigger token | The value clients must send as X-REST-Tracer; clearing it generates a new one |
| Capture | Toggle hook callbacks, SQL queries, outbound HTTP independently |
| Max operations per trace | Safety cap — traces that hit it are marked truncated |
| Keep last N traces | Retention; older traces are pruned automatically |
FAQ
Is it safe on production? In the default Header mode, nothing is traced (and overhead is near zero) unless a request carries the secret token. Tracing itself adds a small per-hook cost, so avoid long "Always" sessions on busy sites.
Where are traces stored?
A custom table (wp_rest_tracer_traces), gz-compressed when large, pruned to your retention limit.
Does it trace the tracer? No — the plugin's own admin REST API is only ever traced with an explicit header, even in Always mode.
What's not captured?
Raw internal PHP calls that never pass through the hook system, WPDB, or the HTTP API (a plain str_replace() inside a controller, for instance) appear as part of their parent's self time — that level of detail needs Xdebug/Tideways.
What happens on uninstall? The traces table, settings, and per-user viewer preferences are removed cleanly.
License
MIT — free to use, modify, and distribute. See LICENSE.
Built by rafiahmedd.